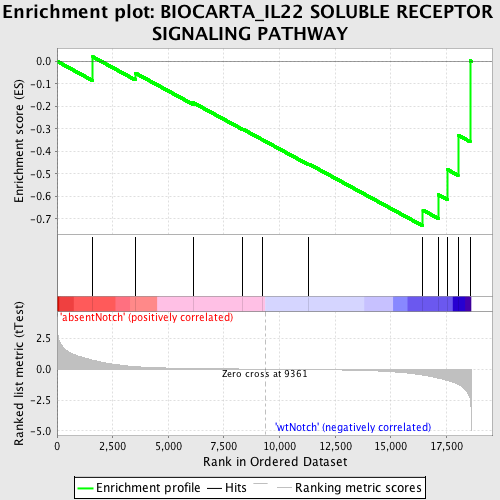
Profile of the Running ES Score & Positions of GeneSet Members on the Rank Ordered List
| Dataset | Set_03_absentNotch_versus_wtNotch.phenotype_absentNotch_versus_wtNotch.cls #absentNotch_versus_wtNotch.phenotype_absentNotch_versus_wtNotch.cls #absentNotch_versus_wtNotch_repos |
| Phenotype | phenotype_absentNotch_versus_wtNotch.cls#absentNotch_versus_wtNotch_repos |
| Upregulated in class | wtNotch |
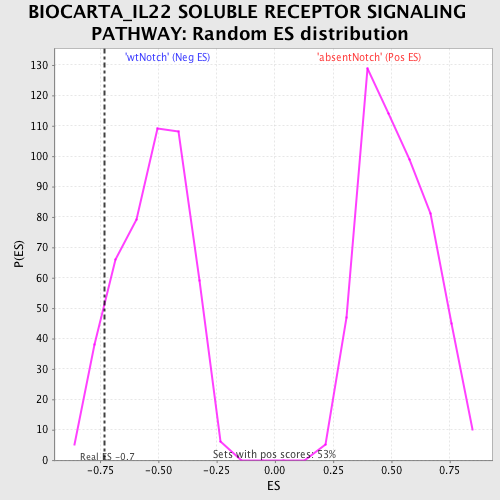
| GeneSet | BIOCARTA_IL22 SOLUBLE RECEPTOR SIGNALING PATHWAY |
| Enrichment Score (ES) | -0.73204607 |
| Normalized Enrichment Score (NES) | -1.4027191 |
| Nominal p-value | 0.08510638 |
| FDR q-value | 0.6522747 |
| FWER p-Value | 1.0 |
| PROBE | DESCRIPTION (from dataset) | GENE SYMBOL | GENE_TITLE | RANK IN GENE LIST | RANK METRIC SCORE | RUNNING ES | CORE ENRICHMENT | |
|---|---|---|---|---|---|---|---|---|
| 1 | IL10RA | 1770164 | 1606 | 0.725 | 0.0198 | No | ||
| 2 | JAK1 | 5910746 | 3521 | 0.209 | -0.0524 | No | ||
| 3 | IL22RA2 | 460113 | 6114 | 0.055 | -0.1837 | No | ||
| 4 | IL22RA1 | 5720603 | 8342 | 0.014 | -0.3012 | No | ||
| 5 | IL22 | 1660102 | 9229 | 0.002 | -0.3486 | No | ||
| 6 | STAT5B | 6200026 | 11319 | -0.029 | -0.4566 | No | ||
| 7 | STAT3 | 460040 3710341 | 16445 | -0.480 | -0.6618 | Yes | ||
| 8 | STAT1 | 6510204 6590553 | 17138 | -0.723 | -0.5932 | Yes | ||
| 9 | STAT5A | 2680458 | 17538 | -0.913 | -0.4809 | Yes | ||
| 10 | SOCS3 | 5550563 | 18023 | -1.220 | -0.3283 | Yes | ||
| 11 | TYK2 | 1660465 1740736 | 18564 | -2.459 | 0.0028 | Yes |